Data Science
Performance Evaluation
Regression Problems / Classification Problems / Clustering Problems
Classification Problems
We own a credit card company, and we are
using data mining method to detect the fraud.
MY algorithm’s prediction accuracy is 98%
(98 correct out of 100 cases)
YOUR algorithm’s prediction accuracy is 99% (99 correct out of
100 cases)
| Comparison between two algorithms | ||||
| Accuracy | Precision | Recall | F1 Score | |
| Mine | ||||
| Yours | ||||

Now, I own a winery, and use a robot to help me to collect
grapes to make the wine.
Majority of robot’s collections are
Merlot (super good; BIG and sweet); some are blueberry (bad,
ruin my wine; SMALL and sour).
Now I want to design another robot to pick the right fruits
(JUST BY THE DIAMETER) to start the fermentation. What diameter
shall I choose to get better performance.
MCC score
The Matthews correlation coefficient is used in machine learning as a measure of the quality of binary (two-class) classifications, introduced by biochemist Brian W. Matthews in 1975.

Precision-Recall Curves
A precision-recall curve is a plot of the precision (y-axis) and the recall (x-axis) for different thresholds
PRcurve of the winery example.
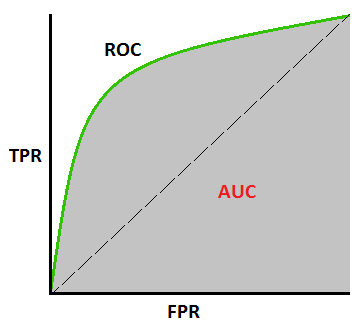
ROC Curves
A receiver operating characteristic curve, or ROC curve, is a graphical plot that illustrates the diagnostic ability of a binary classifier system as its discrimination threshold is varied.
Basicly, it is FPR vs TPR.
FPR = FP / (FP + TN);
TPR = TP / (TP + FN);
Connect all dots together, to get ROCcurve of the winery example.
AUC (Area under the curve)
The AUC value is equivalent to the probability that a randomly chosen positive example is ranked higher than a randomly chosen negative example.
AUC of ROC of the winery example.
Here is one example data for you to plot the following:
Accuracy-curve/Precision-curve/Recall-curve
PR-curve
ROC-curve
and caculate the AUC of ROC-curve