Data Analyzer for GHA (Golf for Healthy Aging Study)
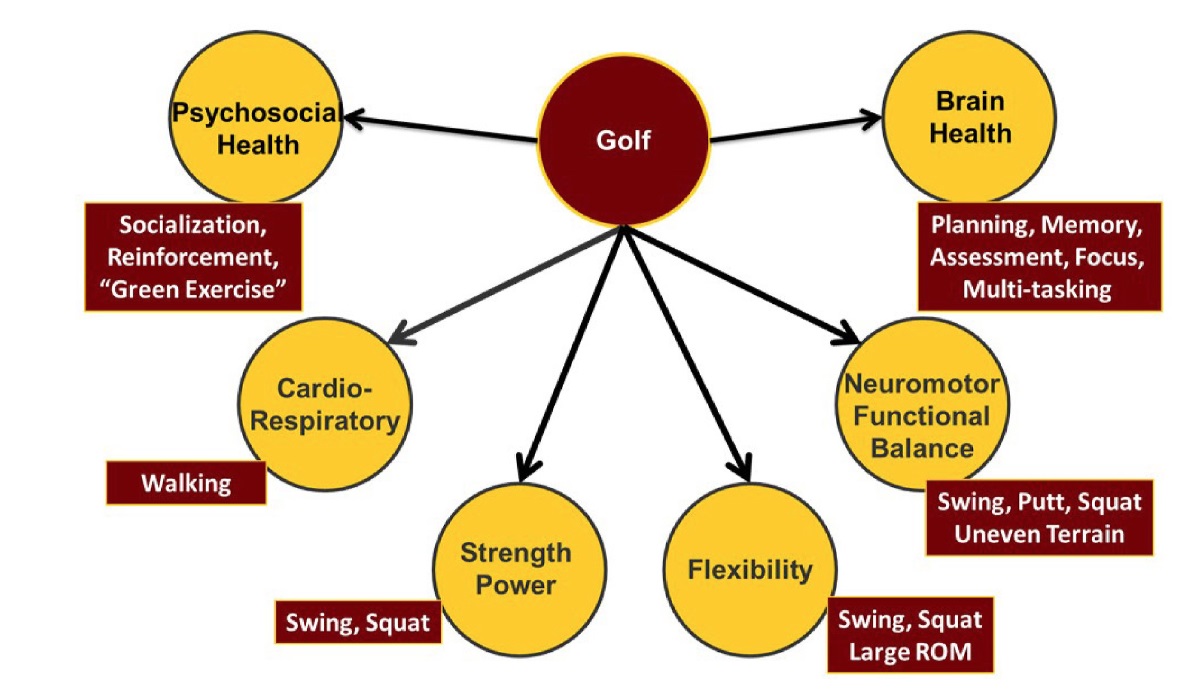
Aging is associated with physiological declines that could impair the ability to perform activities of daily living and thus impair the quality of life of older adults. Golf is an activity that challenges the balance, flexibility, and muscular systems of the golfer and could have important implications in addressing the physiological declines associated with aging. Golf also challenges the cognition of golfer and is typically performed in groups of 2-4 people; therefore, it could also have important implications for the cognitive and social health of older adults. The Golf for Heathy Aging Study (GHA) will investigate the effects of an introductory, recreational exercise golf program on the physiological, cognitive, and social well-being of older adults.
Multimodal exercise interventions are beneficial to many aspects of health in healthy and clinical populations. However, such studies are laborious to conduct and assess because of their involvement of human participants and multimodal nature, which often result in limited sample size and large number of outcome variables. The current study is a secondary analysis on the data obtained from Golf for Healthy Aging (GHA) exercise intervention study. The goal of this work is to propose an analytical framework to perform mathematical abstraction and clustering in typical exercise intervention data to identify a novel systematic method of selecting efficacy test items and generate testable hypotheses regarding intervention effects for future clinical trials. With the modified k-means clustering algorithms, novel information regarding their similarities and interrelations among the outcome variables are generated. These information can be used by kinesiologists to identify combinations of test items that would make up more cost-effective and efficient intervention efficacy assessment methods.
~~~~~~~~~~~~~~~~~~~~~~~~~~~~~~~~~~~~~~~
~~~~~~~~~~~~~~~~~~~~~~~~~~~~~~~~~~~~~~~
Get the Dataset from the experiment.
1, Collect all the %Change data, and merge them into a big CSV file.
2, Calculate the correlation coefficient of each pair of the %change. Matrix format
3, Highlight all the pairs with high positive/negative correlation. Plot the Heatmap(small size) Heatmap(full size) (Interactive version web-tool). Built a webbased tool to display the top pos/neg related %Change for the given (user input) term.
4, Use the
clustering algorithm
(use expected cluster# as parameter, input and output filenames should
be adjusted by the user) to categorize
all the %Change term into subgroups
5, Apply the statistical analysis on each
subgroups and cross dataset validation.
6, Use the
BetaCV algorithm to calculate a
BetaCV value for each set of clusters.
7, Calculate p-values based off of BetaCV results
compared with mean of BetaCV calculations of 100 rounds of randomly organized
clusters.
Resulting data organized into columns of
number of clusters, BetaCV value for K-means, BetaCV values for random clustering
(Mean ± STD),
and P-value.